Disease activity and medication graphs
![]() The graphics page is displayed by clicking on the graphics menu button, as shown:
The graphics page is displayed by clicking on the graphics menu button, as shown:
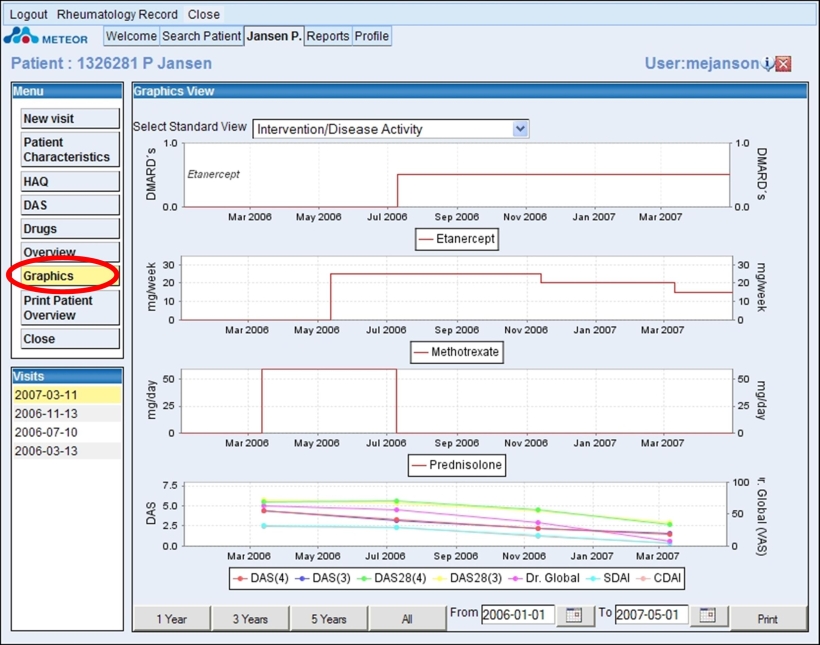
![]() On entering this page, the application will automatically display data for a 3 year period.
On entering this page, the application will automatically display data for a 3 year period.
![]()
© 2007 The METEOR Foundation, all rights reserved